Draw My CA Districts
User Guide
Welcome to Draw My CA Districts!
Welcome to Draw My CA Districts! This user guide provides instructions on creating redistricting plans for California’s State Senate, State Assembly, Board of Equalization, and Congressional districts.
Draw My CA Districts is a free-to-use online redistricting tool that allows users to work with the same geographies and data that the California Citizens Redistricting Commission will use to create our new statewide election districts. Through Draw My CA Districts, you can create redistricting plans while referencing the population data associated with each district in your plan. When you are finished, you can submit your district input directly to the California Citizens Redistricting Commission (“the Commission”). Everyone who lives in California is invited to participate.
Learn more about the California Citizens Redistricting Commission here.
How to use Draw My CA Districts
Through Draw My CA Districts, you can draw one district, a few districts, or a redistricting plan for the entire state of California..
When you are creating districts, try to follow these guidelines:
- Try to keep each district in your plan to within 5% above or below the ideal population for the district type you are working on. You can check the % Deviation column in the Statistics Panel as you work. The % Deviation indicates how far above or below the ideal population the districts in your plan are. The ideal population for each level of California’s statewide districts is:
- State Assembly: 494,043
- State Senate: 988,086
- Congressional: 760,066
- Board of Equalization: 9,880,859
- Your districts should be drawn as one shape on the map. Avoid drawing a map that represents your district as broken up into more than one piece.
When you are finished with your district map, send it to the Commission by clicking the “Submit” button. Your district map and comments will be sent directly to the California Citizens Redistricting Commission for consideration during the line drawing process.
Log In or Use as a Guest
You can use Draw My CA Districts as a guest or by creating an account. If you make an
account
you’ll be able to save your work as a draft and finish it later. You will also be able to view
any maps you submitted to the Commission at an earlier date. If you already have an account with
Draw My CA Districts, you can use the
same login information for
this tool.
To create a new account, click the “Sign up here” link on the home page, complete the
form, and
check your email. Follow the instructions in the email we send you to verify your account. If
you do not see a verification email, check your spam or promotions folder.
Once you log in to your account, you will be taken to a page called “My Maps.” Click “Start
a
New Map” to draw your first district.
To use the tool as a guest, click “Continue as Guest” at the login page. You will be able
to do
everything a logged in user can do except save your work to edit at a later time and run some of
the district compliance checks. If you start using Draw My CA Districts as a guest and
decide
you would like to save your work, you can still create an account and log in after you’ve
started drawing your district map.
Languages
Draw My CA Districts is available in English and Spanish. You can change the language you
are
working in at any time.
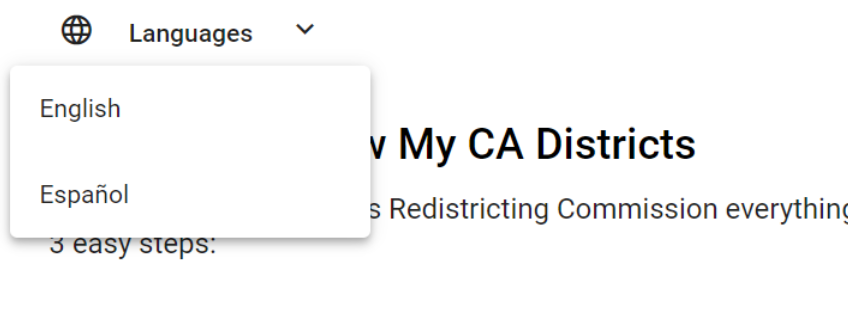
At the Welcome Page, you can change the language by clicking the “Languages” menu in the top
left corner of the window.
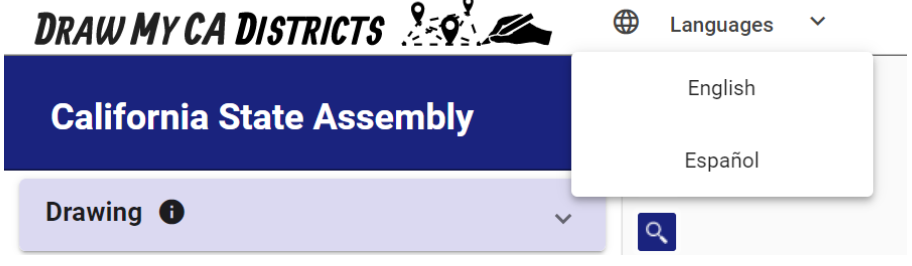
You can also change the language from the main page of Draw My CA Districts by clicking the “Languages” menu at the upper left-hand corner of the screen.
Drawing
Click on the word Drawing on the left-hand side of the page to expand this section. You will see the tools you can use to move the map, draw your map, and more.
Moving the Map
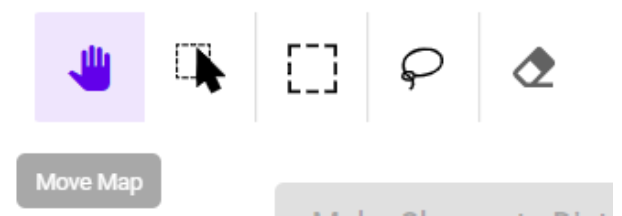
Move MapWhen you open Draw My CA Districts, the Move Map button is enabled by default. You
can click on this icon at any time to use this tool.
Click and drag anywhere on the map to move the map.
 ZOOMING IN AND OUT
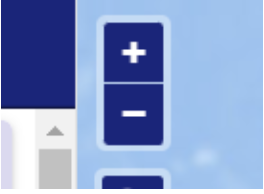
To zoom in and out of the map, click the “plus” or “minus” [“+”/”-”] buttons at the top left corner of the map area or use the trackpad on a laptop or the wheel of a mouse.
Drawing Tools
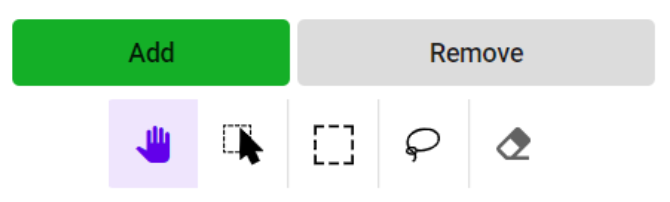
You can create a new district or add or remove area from an existing district by using the drawing tools to make selections. Before making a selection, choose “Add” or “Remove” mode, and then use the drawing tools to select shapes on the map:
- Add by Clicking: To add area to your districts, click individual shapes in the Drawing Layer to add those shapes to your district map.
- Add by Rectangle: Click and drag across an area on the map.
- Add by Freehand: Click and freehand draw an area on the map.
- Deselect Area: To erase area from your selection, either click or click and drag across an area.
- Undo/Redo: Undo or redo recent changes.
After selecting an area on the map, click “Make Changes to District” to update the shape of your district.
Creating a District
The selection you make with the drawing tools will be represented by a highlighted area on the map. To create your first district, highlight an area on the map, click “Make Change to District,” and name your new district.
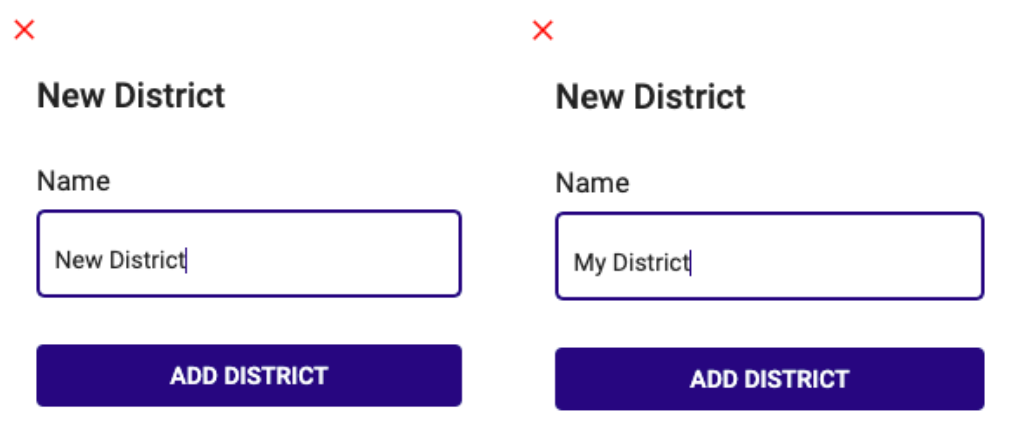
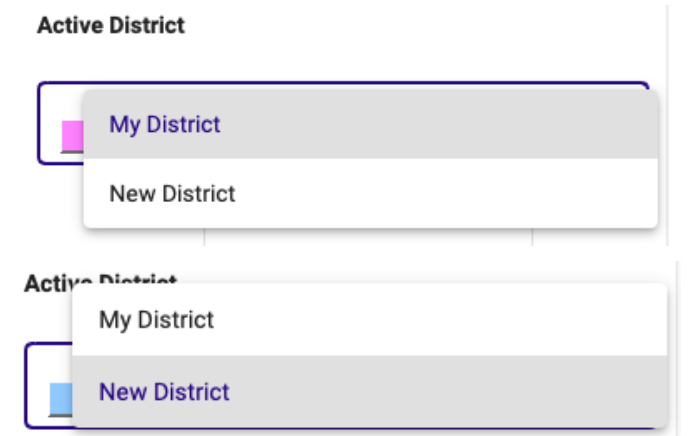
Your district will now appear shaded in on the map, and its name will display in the “Active District” dropdown menu. After creating your first district, you can create additional districts by selecting “New District” from this dropdown menu and following the same steps to select area and create another district.
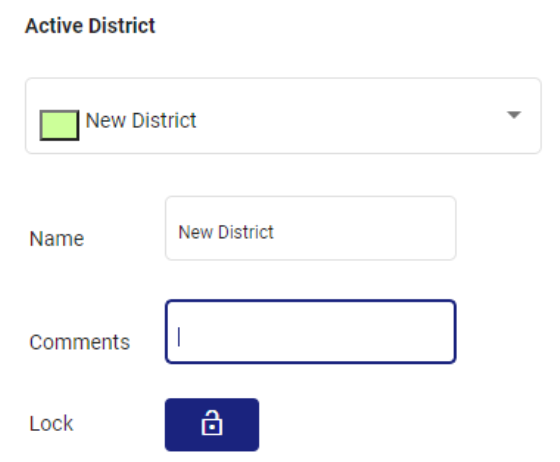
Comments
If you want to add a note to any individual district you create, you can use the ‘Comments’ box to enter text. District comments will be sent to the California Citizens Redistricting Commission with your district map.
Making Changes to Districts
To edit an existing district, first select the district’s name in the “Active District” dropdown
menu. Then choose either “Add” or “Remove” mode and use the drawing tools to make selections. If
you are adding area to your existing district, select areas outside of it. If you are removing
area from your district, select areas within it. Click “Make Change to District” to add or
remove the selected area from your district.
Changes must be applied by clicking “Make Change to District” before you switch between Add or
Remove mode, as a selection can only be made in one mode at a time. Similarly, changes must be
applied before you zoom between different drawing layers, as a selection can only be made in one
drawing layer at a time. If you attempt to switch modes or drawing layers without first clicking
“Make Change to District,” you will be prompted to either clear your selection in order to
proceed or remain on your selection and apply changes.
You can also update the name or comments on the Active District at any time. Remember to apply
these changes by clicking “Make Change to District.”
What’s on The Map?
The map area displays the "Basemap” and the “Drawing Layer.”
The Basemap is the background map that appears in the map area of the screen. It
shows the streets, rivers, schools, and other landmarks commonly displayed on online maps. The
closer
you zoom in, the more detailed the basemap will appear.
You can change the basemap by choosing a different one from the Basemap style
drop-down list.
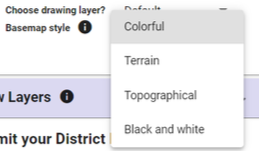
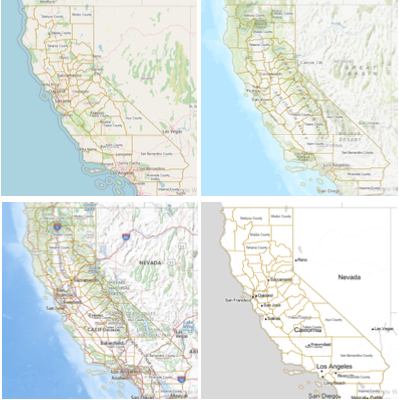
The available basemap styles are:
- Colorful
- Terrain
- Topographical
- Black and white
You will use the Drawing Layer to “draw” where your districts are located on the map. The Drawing Layer is displayed in the map area on top of the basemap. The Drawing Layer appears as part of the map, but shows different information than the basemap does.
While the basemap helps you orient yourself on the map, the Drawing Layer shows the boundaries of counties, cities, and towns in California along with smaller levels of detail as well.
For example, the basemap might help you find your community on the map based on a highway or river near your house, while the Drawing Layer will show you the exact boundaries of the city or county you live in.
Just like the basemap, the Drawing Layer will automatically change to show you more detail as you zoom into the map.
Using the Drawing Layers
Only one Drawing Layer will appear on the map at a time. The Drawing Layer that is displayed on the map at any given time is the layer you can use to draw your districts using the drawing tools.
Default Drawing Layers
By default, the map will automatically switch between different Drawing Layers based on your zoom
level.
The Drawing Layer section under the “Drawing” section on the side panel will show you
which Drawing Layer is currently visible on the map. The name of the layer will be displayed in
the
same color as the layer’s lines that appear on the map. As you zoom into the map, the Drawing
Layer will automatically change to show you more detail, with smaller individual shapes that
make up the Drawing Layer. That means the closer you zoom in, the more detail you'll be able to
use to draw your districts. As you zoom out of the map, the Drawing Layer will change to show
you less detail.
For example, if the Drawing Layer shows the boundaries of counties, you will be able to add a
county to your district map. If you zoom into the map, the Drawing Layer will automatically
change to display cities. You will now be able to add a city to your map. You do not have to use
only one Drawing Layer to create your district map. In this example, both the county and city
would be included in your map.
Choosing the Drawing Layer
The Drawing Layer section under “Drawing” will show you which Drawing Layer is currently visible
on the map. The name of the layer will be displayed in the same color that the layer’s lines
appear on the map . As you zoom into the map, the Drawing Layer will automatically change to
show you more detail. As you zoom out of the map, the Drawing Layer will change to show you less
detail. Make sure to save your area selection by clicking “Make Change to District” before you
switch to a new Drawing Layer, or else you will lose your selected area when you switch to the
new Drawing Layer.
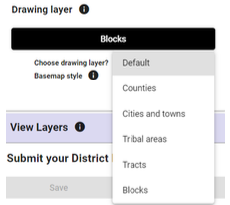
If you want to use a specific Drawing Layer, but that Drawing Layer does not appear on the map
by default based on your zoom level, click the Choose Drawing Layer drop-down list below
the
Drawing Layer label. Choose the layer you want to work with. Now you can work with the layer of
your choice in a zoom level that works for you.
For example, if the Drawing Layer is displaying cities and towns and you want to add a county to
your map, but don’t want to zoom out of your current view, you can choose “Counties” from the
Choose Drawing Layer drop-down list instead of zooming out of the map. Once you choose
“Counties” as your Drawing Layer, you will be able to add a county to your district map.
To switch back to having the zoom level automatically control the Drawing Layer, click "Default"
in the Drawing Layer drop-down list.
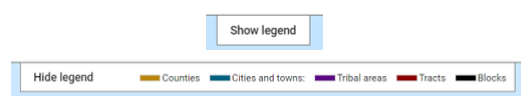
Map Legend
The Drawing Layers are color coded. For help remembering which color corresponds with each Drawing Layer, toggle the map’s Legend on and off.
Where did the Drawing Layers come from?
Draw My CA Districts works with five Drawing Layers. Each layer shows a different level
of detail in the shapes that make up the layer. The Drawing Layers are based on census
geography,
which is created by the U.S. Census Bureau. This is the geography the California Citizens
Redistricting Commission will be using to create districts.
There are many levels of census geography - ranging from large (nation-wide) to small (block).
This is the list of census geography levels we use as our Drawing Layers, in order of
largest to
smallest:
- Counties:
- This layer represents each of the counties in California.
- Cities and Towns:
- This layer is based on the Census Geography unit called, “places”. This layer represents what we think of as cities and towns in California. It includes incorporated and unincorporated places.
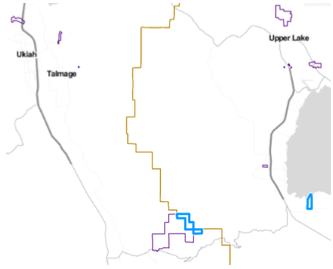
- Tribal Areas
- This layer includes all legal and statistical tribal areas in California. These are the Reservations and Rancherias throughout the state.
- Tracts:
- Generally speaking, there are often multiple census tracts in a city, but a census tract might be larger than a small, rural town. Tracts do not necessarily follow the same boundaries as cities and towns.
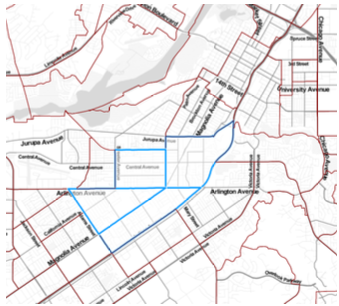
- Blocks:
- This is the smallest unit of census geography. In metropolitan areas, a census block may be the size of a city block, in rural areas the space covered by a single census block is often much larger.
District Statistics
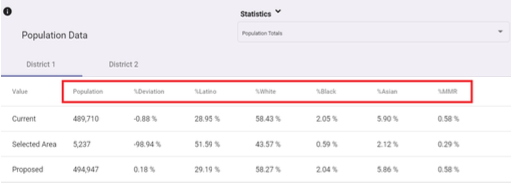
Click the word “Statistics” at the bottom of the map to expand the Statistics Panel. Here you can access information about the population and demographics of the district you are actively working on.
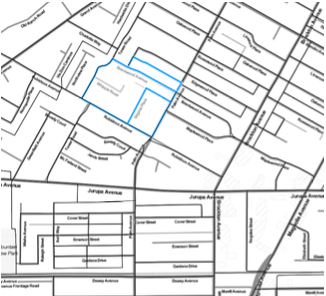
The Statistics Panel displays population-related statistics of your active district and any other districts affected by changes to the active district. The active district and any affected districts are listed in the tabs above the statistics table. In the example below, District 1 is the active district, and the area selected to add to it would be removed from District 2.
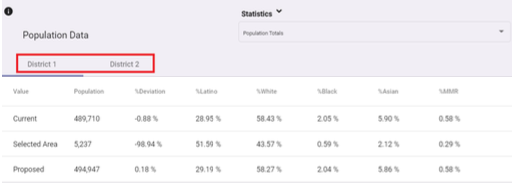
The statistics shown in the “Current” row include demographics associated with areas already assigned to the active district. The population data of the geography highlighted in blue on the map is listed in the “Selected Area” row. The “Proposed” row shows what the statistics of the active district will be if you add or remove the selected area to your active district.
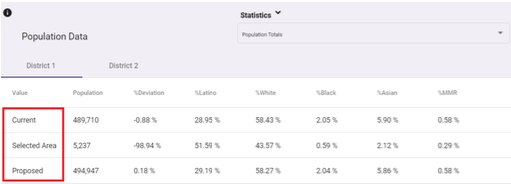
The demographics available on the Statistics Panel include the total population and race and ethnicity data of people who live in the district you are working on. The Statistics Panel also shows the “% Deviation,” which indicates how far below or above the population of your active district is from the ideal population of the district type you are working on.
The ideal population for each level of California’s statewide districts is:
- State Assembly: 494,043
- State Senate: 988,086
- US House of RepresentativesCongressional: 760,066
- Board of Equalization: 9,880,859
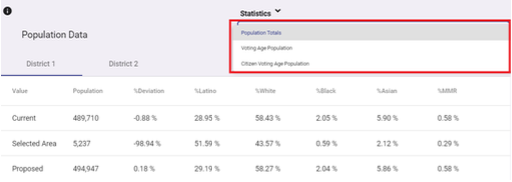
In addition to total population data, the Statistics Panel also displays race and ethnicity statistics by Voting Age Population and Citizen Voting Age Population. To change what type of data is displayed on the Statistics Panel, click the dropdown menu in the top right-hand corner of the panel and choose a data category.
Saving
If you are logged into your Draw My CA Districts account, you can save your work as a draft.
- Click the “Save” button at the bottom left-hand corner of the screen.
- Click “Yes, Save Draft” to save your work
If you are using Draw My CA Districts as a guest, you will be asked to create an account in order to save a draft.
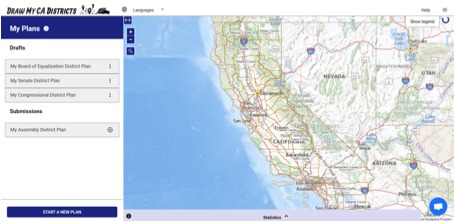
My Plans
When you save a draft, you will be taken to the My Plans page, where you will find a list of all
your saved drafts and submissions. When you click on a draft or submission, the map of those
districts will appear on the screen.
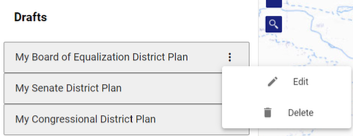
To edit a draft, click the three dots next to the name of the draft. Choose “Edit” to keep
working on your districts.
Submitting
When you are ready to send your district map and comments to the California Citizens Redistricting Commission, click “Submit.” You will have one last chance to review your work before it is sent to the Commission. Once your plan is submitted, you cannot make any further changes.
- Review your district statistics and the results of the Compliance Check on your plan.
- Add any general comments about your redistricting plan that you’d like to share with the Commission.
- Click “Submit.” Your input will be sent to the California Citizens Redistricting Commission!
- If you are logged in when you submit, you will receive an email verifying that your district map has been sent to the Commission.
- We suggest you download a copy of your input right after submitting. That way you will have a copy of your input for your records!
Input submitted through Draw My CA Districts will be reviewed and considered, however, the districts you create are not guaranteed to be kept together in California’s new redistricting plans.
Learn more about the California Citizens Redistricting Commission and California’s redistricting process here.