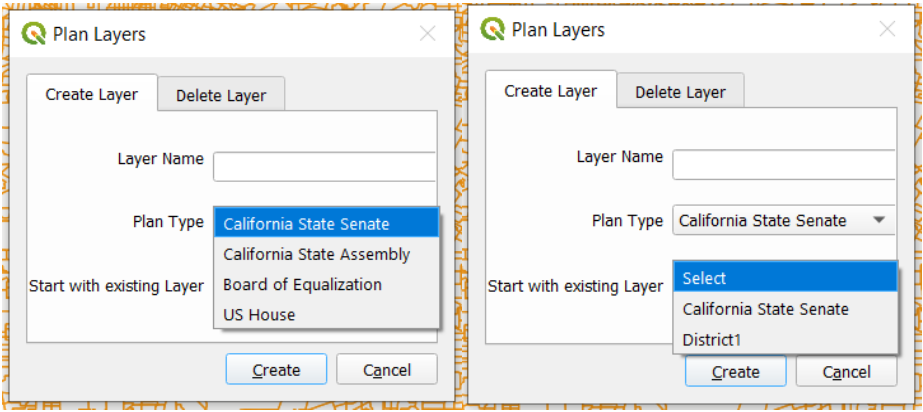
This section accounts for the majority of the guide, as it details how to use the plugin's
redistricting tool. Creating a layer under Plan Layer Management will automatically open the
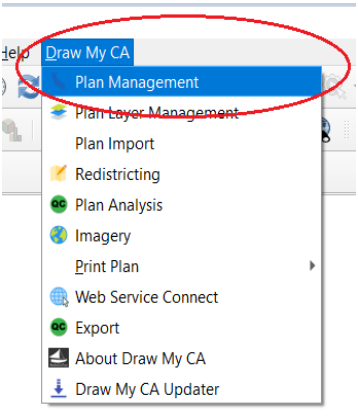
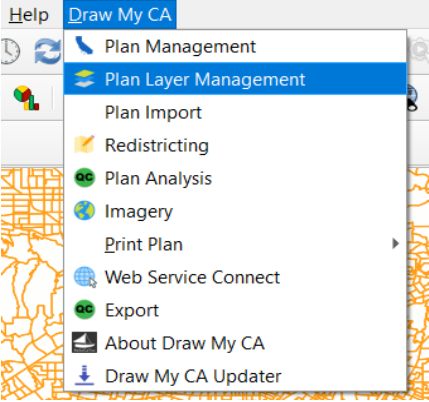
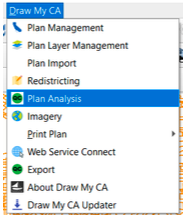
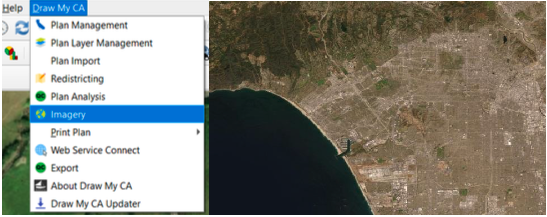
Redistricting Panel in the bottom left corner of QGIS. Selecting "Redistricting" from the "Draw
My CA" plugin opens the Redistricting Panel on its own.
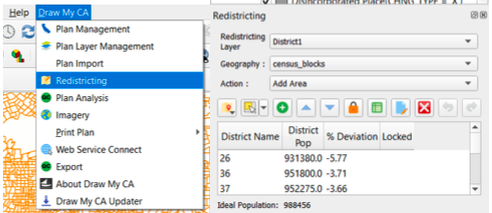
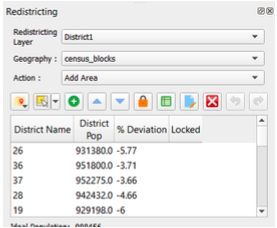
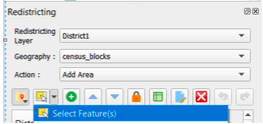
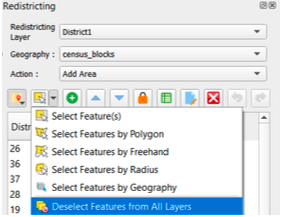
Redistricting Panel
Redistricting Layer
Select which layer you would like to make edits on from the drop down menu.
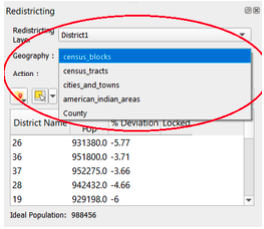
Geography
Select which level of Census geography you would like to make edits using from the drop down
menu. This can be changed at any time.
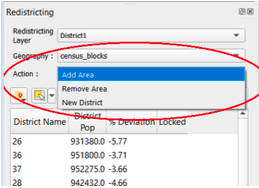
Action
Select which action you would like to take in editing - "Add area," "remove area", or "New
District."
Redistricting Tools
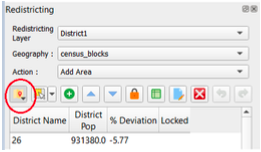
Select District
Press this button and click anywhere on the map to choose which district you want to work in. The
district will be shaded in on the map and highlighted on the list in the Redistricting panel.
You must also select a district you would like to add or remove an area in, either from the list
of districts in the Redistricting panel or through the "Select District" icon and clicking on
the map.
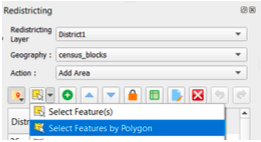
Select Features by Area
Choose what method of selection you would like to use in your edits from the drop down menu.
Select Feature(s)
Click and drag across an area on the map to select by rectangle, or simply single click to select one feature.
Select by Polygon
Create a polygon shape by single-clicking the corners. Right click when done drawing.
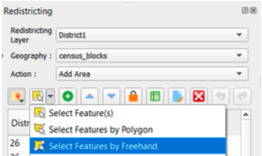
Select by Freehand
Single click to start, then draw a freehand shape. Right click when done.
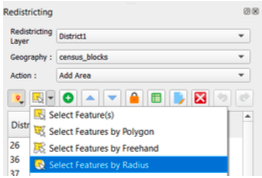
Select by Radius
Single click and move mouse to determine radius. Right click when done.
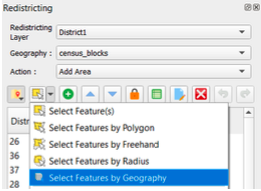
Select by Geography
Choose the layer from the list, then single click on the map in the desired area.
Deselect Features
This will deselect any area that is currently highlighted in all areas.
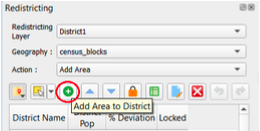
Add Area to District
Once you have selected your desired area, it will be highlighted on the map. You can add the
selected area to the district by clicking on the desired district in the Redistricting Panel
and then clicking the green plus icon (equivalent keyboard shortcuts are "alt +" and "alt -").
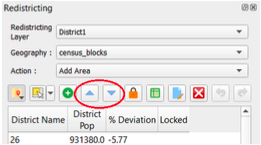
Navigate District List
You can move through the list of districts by using the up and down arrow icons in the
redistricting panel, or through the arrow keys on your keyboard. The map will recenter to the district
you have selected in the list and will shade the selected district on the map.
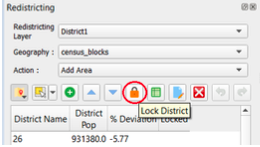
Lock District
Once you are satisfied with the boundaries of one district, you can lock the district through
clicking the orange closed lock icon on the Redistricting Panel. Locking a district will prevent
any future edits to selections from the locked area.
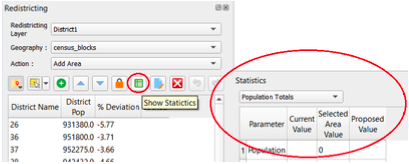
Show Statistics
The "show statistics" icon appears as a green spreadsheet and will close or open the statistics
panel in the bottom right of the screen.
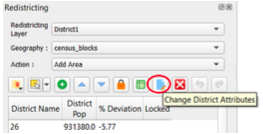
Change District Attributes
If you would like to change the title of the district or add comments about the district, you can
do so by clicking the "Change District Attributes" icon that appears as a blue piece of paper
with a yellow pencil in the right bottom corner.
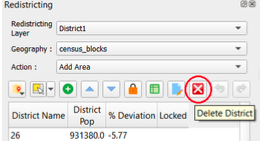
Delete District
The icon that appears as a red square with a white "X" inside is the Delete District button. If
you would like to permanently remove a district, select the desired district in the list in the
Redistricting panel and click this icon.
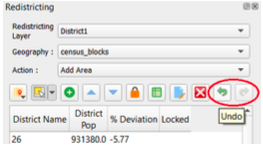
Undo/Redo
To undo or redo the most recent changes you made on the map, you can do so by clicking the green
arrow icon pointing to the left (undo) and the green arrow icon pointing to the right (redo).
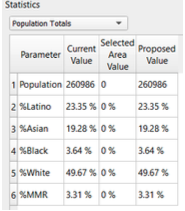
Statistics Panel
This panel displays the statistical information about the district in the layer which you are
working. You can change what parameters are shown in the statistics panel through the drop down
menu in the top left corner of the panel.